Paratransit costs increased a total of $138 million over the past two years. Roughly $84 million (59%) was due to MTA carrier trip cost increases ($40 million in 2018) and administrative cost increases ($44 million in 2019). The other $56 million (41%) was due to net trip cost increases for e-hail service and new demand ($17 million in 2018 and $39 million in 2019). The MTA delivered 2 million additional trips and saw an increase in 11,000 registrants during the same two-year period, asserting that budget increases were due to demand increases due to e-hail.
In Stats 101, we had to look for examples of “junk charts” that presented misleading information. Due to that trained skepticism, something didn’t seem right to me back in April, when Andy Byford presented several slides to show how the growth in paratransit demand and costs were both driven by an “E-hail pilot program,” accounting for a whopping $62M dollar increase in one year. On a per-trip basis, e-hail rides cost $37 each, while carrier service costs $86, and broker $29. The presentation said, “Of 2.1 million e-hail trips in 2018: 1 million are new demand and 1.1 million represent shift from carrier and broker.” They admitted that they saved some money from the less-costly e-hail rides, but due to fixed costs, not as much as they anticipated. But, the thing that should have immediately jumped out at me was the claim that 1 million “new” $37 rides cost them $62 million.
For background, paratransit (also known as Access-A-Ride (AAR), Excess-A-Ride, Access-A-Mess, or Stress-A-Ride) is an ADA mandated service that must be provided to passengers with disabilities who cannot use fixed route public transit service (i.e. bus or subway) without assistance other than operation of a wheelchair ramp or lift. There are currently 161,000 registered paratransit customers, a number that is expected to grow in the next decade as our city’s population ages. The paratransit budget was somewhat flat from 2015-2017, but shot up to from $475M to $537M in 2018, and again to $612M in 2019. These figures are more or less in line with a CBC report that used the MTA’s own internal cost projections for planning, except with a larger-than-anticipated year over year cost increase of 13-14% from 2017 to 2018 and again from 2018 to 2019.
“E-hail” refers to two separate pilot programs with the same name that were both intended to reign in costs for the service by switching some expensive MTA carrier trips to taxis. For one group in the pilot, 1,200 participants were given access to “on-demand e-hail service,” meaning they could summon a taxi through an app or by calling a dispatcher for immediate service rather than booking a minimum of 24 hours in advance. The other group were registrants who were allowed to request a taxi as their vehicle when they made their day-before request. This was referred to as “advanced registration e-hail” and at its peak, included 25,000 passengers. In a controversial move, the MTA made the decision to end the advanced registration e-hail program, in favor of moving to an “enhanced broker service” which replaced more traditional service with broker vehicles, including black car services, Lyft vehicles, and Curb taxis. A month later, they presented their rationale for making the change without communicating their intentions with advocates who were part of the Access-A-Ride Reform Group (AARRG) and had been meeting regularly with the MTA. Despite what they claimed was a rapidly growing demand for on-demand e-hail service, they decided to leave the on-demand service untouched for the 1,200 passengers in order to see when demand would peak.
The MTA is notorious for its lack of transparency, but they do share some information, albeit in a format that is not very accessible. The MTA paratransit dashboard shows the number of trips per type (Primary, branded blue and white vehicles; Broker, livery and car-share services; E-hail, taxis). A right click to select “show data” will present the figures in a table, but there is no way to export the table or even copy and paste into a spreadsheet. I had to hack the CSS using my browser developer tools to see the historical data on one page, zoom in, grab a screenshot, and use optical character recognition (OCR) to get the data into a text format. Since there are no additional details on the dashboard, like the cost per trip by type or registered users, a full picture was hard to piece together until that April board presentation.
The e-pilot program, both on-demand and advanced reservation, is/was extremely popular, partly because modern taxis are more comfortable than boxy buses with poor shock absorbers, and partly because the trips have more direct routes than the shared van service which took people on regular “tours de boroughs” to reach their destination. Many users testified at board meetings that the taxi service was more reliable from an on-time-performance perspective (OTP), although those stats were never collected for e-hail trips or shown on the dashboard. Many on-demand customers declared that it was life-changing, as they could suddenly travel spontaneously in a way that the carrier service never allowed. For once, the MTA was getting praise for its paratransit service, but that would not last long.
April’s presentation showed an increase in the number of total and “active” registrants.
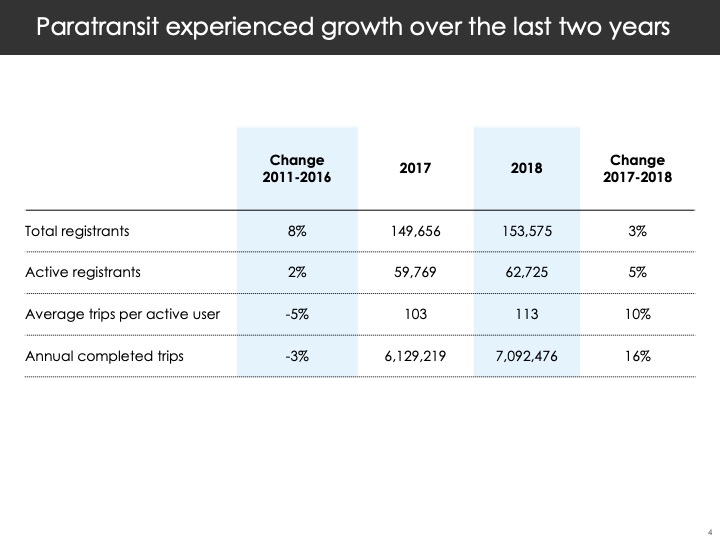
Multiplying the active registrants by average number of trips more or less adds up to the annual completed trips, but the total numbers also match the figures for ALL of the trips they claim to have delivered in 2017 and 2018 (see the slide below). Does this mean that the ~90,000 non-active registrants took no trips at all?
| 2017 | 2018 | |
|---|---|---|
| Total Registrants | 149,656 | 153,575 |
| Active Registrants | 59,769 | 62,725 |
| Average trips per active user | 103 | 113 |
| Annual completed trips (in slide) | 6,129,219 | 7,092,476 |
| Annual completed trips (calculated) | 6,156,207 | 7,087,925 |
Byford then moved on to the justification for abruptly ending the e-hail advanced registration program. [Note: giving Andy the benefit of the doubt, I will assume that he was just the messenger, so I’ll refer to the presentation authors as “they.”] First, they displayed the total number of trips over a 3 year period, broken down by 3 main service types.
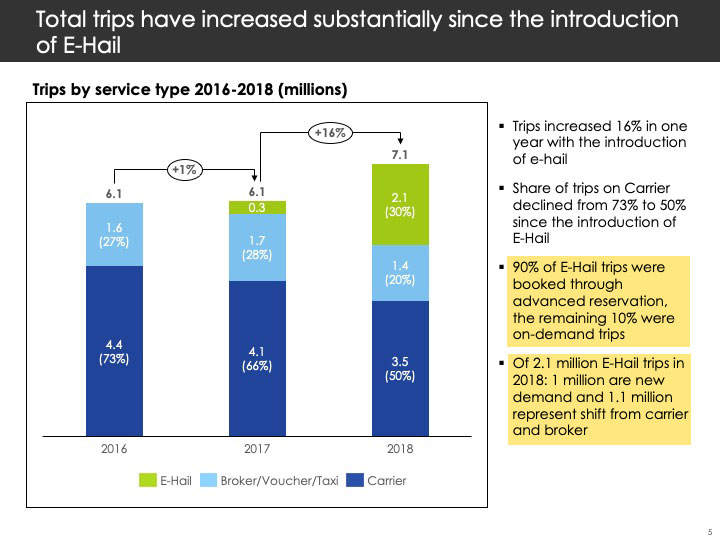
Here are the same numbers in a table format:
| Carrier | Broker/Voucher/Taxi | E-hail | TOTAL TRIPS | |
|---|---|---|---|---|
| 2016 | 4,400,000 | 1,600,000 | 0 | 6,000,000 |
| 2017 | 4,100,000 | 1,700,000 | 300,000 | 6,100,000 |
| 2018 | 3,500,000 | 1,400,000 | 2,100,000 | *7,100,000 (row total = 7M) |
| 2017-2018 change (shift to e-hail + new e-hail) | -600,000 | -300,000 | 900,000 | |
| 1,000,000 | ||||
| Trip Types 2018 (according to last bullet point) | ||||
| Displaced | 1,100,000 | <-- above shows 900,000 | ||
| New | 1,000,000 | |||
Something is off here, too. Rounding down or up from each value of the trips displaced by e-hail can’t possibly add up to 200,000 (the difference between the chart numbers and the bullet point for displaced trips).
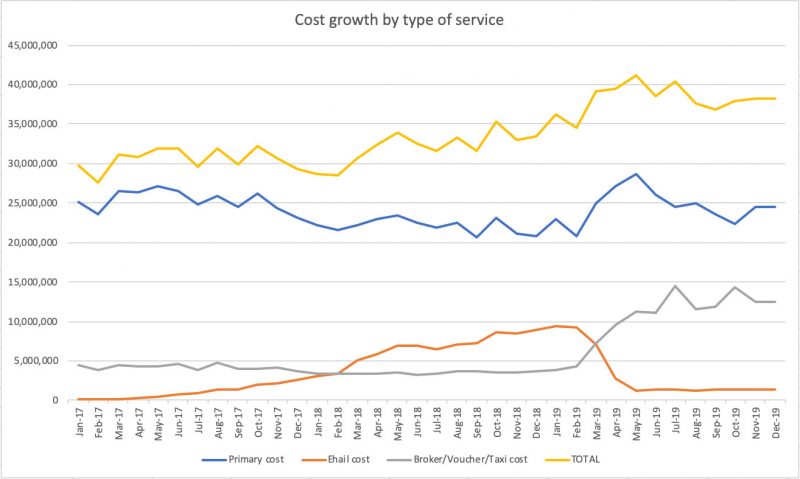
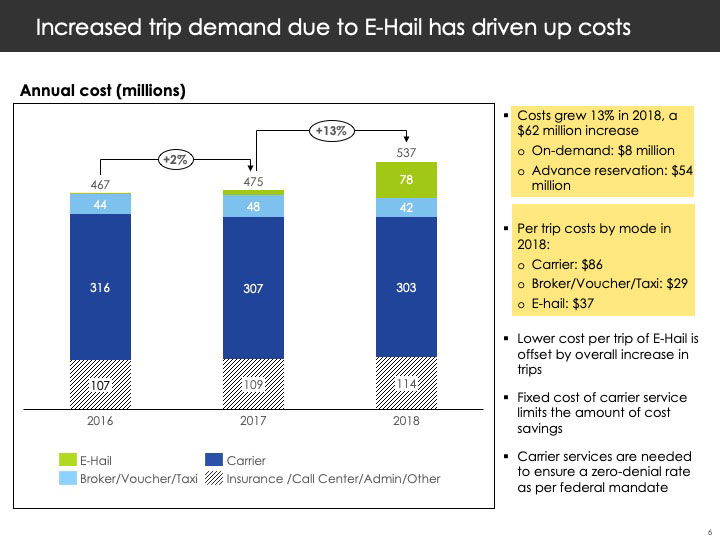 At a glance, it’s tempting to see the top green e-hail segment on the 2018 bar as the explanation for new costs. Looking more closely at the trip costs shows another inconsistency:
According to the first bullet point, the budget increased solely because of E-hail.
“Costs grew 13% in 2018, a $62 million increase
- On-demand: $8 million
- Advance reservation: $54 million”
Again, here are the numbers in a table format, which also includes a total for all trip expenses and the 2017-2018 change:
| (cost in millions) | Primary | E-hail | Broker/ Voucher/ Taxi | Total trip expenses | Administrative costs | TOTAL CHANGE |
|---|---|---|---|---|---|---|
| 2017 | $316 | $11 | $48 | $366 | $109 | $475 |
| 2018 | $307 | $78 | $42 | $423 | $114 | $537 |
| Difference | $57 | $5 | $62 |
Notice how they rolled that $5M administrative cost into the overall $62,000,000 budget increase? At least they helpfully point out how much each trip costs (on average) by service type in the second bullet point:
“Per trip costs by mode in 2018:
- Carrier: $86
- Broker/Voucher/Taxi (3 separate categories on dashboard): $29
- E-hail: $37″
In order to understand how these figures match up with what’s on the dashboard, I created a new spreadsheet with the values from the dashboard and calculated cost totals based on the per-trip average cost:
| Primary | Broker | E-hail | Street hail | All other | Total | |
|---|---|---|---|---|---|---|
| 17-Jan | 334,831 | 111,310 | 4,085 | 32,494 | 8,631 | 491,351 |
| 17-Feb | 315,070 | 104,775 | 3,731 | 17,502 | 11,970 | 453,048 |
| 17-Mar | 353,223 | 120,572 | 4,803 | 20,573 | 12,541 | 511,712 |
| 17-Apr | 350,988 | 116,579 | 6,384 | 19,293 | 12,341 | 505,585 |
| 17-May | 362,259 | 117,286 | 11,606 | 21,155 | 12,782 | 525,088 |
| 17-Jun | 353,764 | 127,581 | 19,416 | 20,795 | 13,411 | 534,967 |
| 17-Jul | 330,373 | 106,982 | 26,041 | 15,720 | 11,967 | 491,083 |
| 17-Aug | 344,539 | 135,273 | 35,628 | 14,786 | 12,421 | 542,647 |
| 17-Sep | 327,253 | 111,466 | 39,020 | 13,979 | 11,408 | 503,126 |
| 17-Oct | 348,446 | 110,414 | 53,493 | 16,524 | 12,473 | 541,350 |
| 17-Nov | 324,036 | 114,314 | 59,471 | 16,705 | 10,433 | 524,959 |
| 17-Dec | 307,650 | 101,588 | 70,491 | 14,267 | 10,307 | 504,303 |
| TOTAL TRIPS 2017 | 4,052,432 | 1,378,140 | 334,169 | 223,793 | 140,685 | 6,129,219 |
| TOTAL COST 2017 | $348,509,152 | $39,966,060 | $12,364,253 | $6,489,997 | $4,079,865 | $411,409,327 |
| 18-Jan | 295,545 | 92,775 | 81,910 | 15,958 | 9,354 | 495,542 |
| 18-Feb | 288,155 | 94,660 | 93,248 | 14,582 | 9,845 | 500,490 |
| 18-Mar | 296,297 | 90,857 | 136,617 | 16,749 | 8,946 | 549,466 |
| 18-Apr | 306,513 | 94,666 | 159,727 | 13,925 | 10,341 | 585,172 |
| 18-May | 311,445 | 96,174 | 188,442 | 17,205 | 11,013 | 624,279 |
| 18-Jun | 300,036 | 88,655 | 185,890 | 12,584 | 9,854 | 597,019 |
| 18-Jul | 291,128 | 92,992 | 175,035 | 13,403 | 9,594 | 582,151 |
| 18-Aug | 299,424 | 102,675 | 190,577 | 17,219 | 10,076 | 619,971 |
| 18-Sep | 275,907 | 100,210 | 195,685 | 15,911 | 9,272 | 596,985 |
| 18-Oct | 308,705 | 93,404 | 233,902 | 17,526 | 10,312 | 663,849 |
| 18-Nov | 281,007 | 99,366 | 229,282 | 11,952 | 9,447 | 631,054 |
| 18-Dec | 276,818 | 103,241 | 242,032 | 14,961 | 9,445 | 646,497 |
| TOTAL TRIPS 2018 | 3,530,980 | 1,149,675 | 2,112,347 | 181,975 | 117,499 | 7,092,476 |
| TOTAL COST 2018 | $303,664,280 | $33,340,575 | $78,156,839 | $5,277,275 | $3,407,471 | $423,846,440 |
For 2018, the numbers mostly align, with total trips around 7.1M and total costs at $424M. But, for 2017, while the number of trips align with the numbers presented (6.1M), the costs are much higher ($411M vs. $366M as presented in slide #6). What’s going on? In order to figure it out, I worked backwards by dividing the overall trip expense by type by the number of trips of that service type. In other words, I took the costs presented in slide #6, and divided by the number of trips per service type presented in slide #5 to get the cost per trip:
| # E-hail trips (millions) | E-hail cost ($ millions) | $per trip (E-hail) | # Broker/ Voucher/ Taxi/Other (millions) | B/V/T trip expense ($ millions) | $per trip (B/V/T) | # Carrier trips (millions) | Carrier trip expense ($ millions) | $per trip (carrier) | |
|---|---|---|---|---|---|---|---|---|---|
| 2016 | 0 | $0 | 0 | 1.6 | $44 | $28 | 4.4 | $316 | $72 |
| 2017 | 0.3 | $11 | $37 | 1.7 | $48 | $28 | 4.1 | $307 | $75 |
| 2018 | 2.1 | $78 | $37 | 1.4 | $42 | $30 | 3.5 | $303 | $87 |
You can see increases in carrier service costs from both 2016-2017 ($3) and from 2017-2018 ($11-$12). This accounts for 5% carrier cost increases for 2016-2017 and nearly 16%, for 2017-2018:
| Cost in carrier service per trip increase 2016-2018 | |
|---|---|
| 2016-2017 | 4.26% |
| 2017-2018 | 15.62% |
Knowing that admin cost increases AND an increase in per-trip cost for carrier service accounts for some of the budget growth, what about those “displaced” e-hail trips which were less expensive than the carrier service? The presentation doesn’t show how the meager drop in overall carrier expenses of just $4M from 2017 to 2018 coincides with the number of carrier trips, which fell by at least 600,000 trips. Assuming the bar chart numbers from slide #5 are correct (and not the bullet points), we can calculate how much money was saved by e-hail service displacing other trip types; as well as how much additional budget was spent on e-hail service, which displaced 300,00 slightly cheaper broker trips and “created” 1.2M new e-hail trips.
| Displacement of other modes with e-hail (assuming demand stays the same) | |||
|---|---|---|---|
| Number | Cost difference | Total Savings | |
| Carrier | 600,000 | $49 | $29,657,142.86 |
| Broker/Voucher | 300,000 | ($7) | -$2,142,857.14 |
| Additional / New E-hail trips (not displacing other modes) | |||
| 1,200,000 | ($37) | -$44,571,429 | |
| Total E-hail Trips 2018 | 2,100,000 | Net E-hail cost 2018 | -$17,057,143 |
| % of 1-year budget increase that can be attributed to E-hail--> | 29.42% | ||
| Cost of carrier service rate increase 2018 | |||
| Number | Cost difference | ||
| 3,500,000 | $12 | -$40,926,829 | |
| % of 1-year budget increase that can be attributed to carrier cost increases --> | 70.58% | ||
| Total E-hail + Carrier service budget impact | -$57,983,972 | ||
These numbers are also more in line with that total cost increase from slide #6, which shows the true overall cost increase of $57M. The numbers clearly don’t support the assertion that e-hail alone caused a $62M budget increase in 2018. In fact, had the per-cost trip for carrier service stayed flat, the MTA would have delivered 1.2M additional trips for a net increase of only $17M to their operating budget (a net cost of about $14 per trip).
Unfortunately, the misleading data doesn’t stop there. While the number of registrants who were allowed to opt into the e-hail (on-demand and advanced registration) grew over the course of 2018, these numbers are not provided on a monthly basis, rather the “average total monthly trips per customer by customer type” were presented. This slide shows a minor uptick in advanced reservations from 13 per user per month on average, and a major uptick in on-demand use from 19 trips per user per month to 32 trips per user per month over the course of the year.
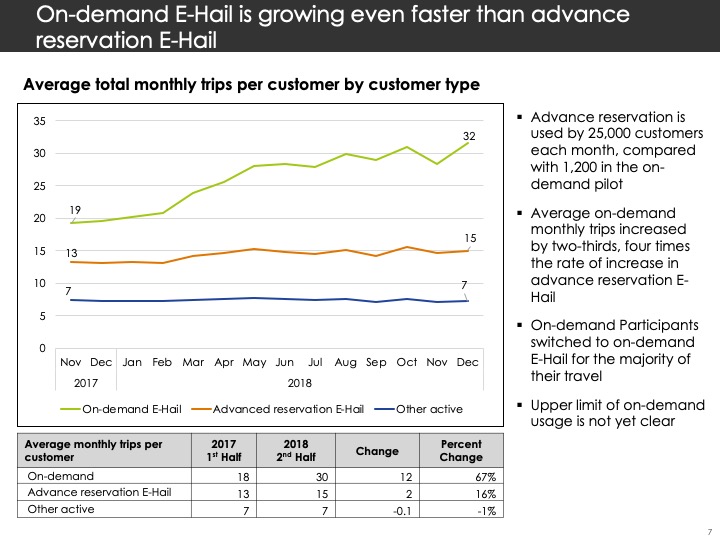 There is no way to verify this information based on the dashboard data, and given that they didn’t separate the on-demand e-hail trips from the advanced reservation e-hail trips from the time the pilot began, the only clue we have into real on-demand usage comes from the 6 months after they ended the larger e-hail pilot. Here is a graph showing the trip increases by type since the beginning of 2017 (click image for table):
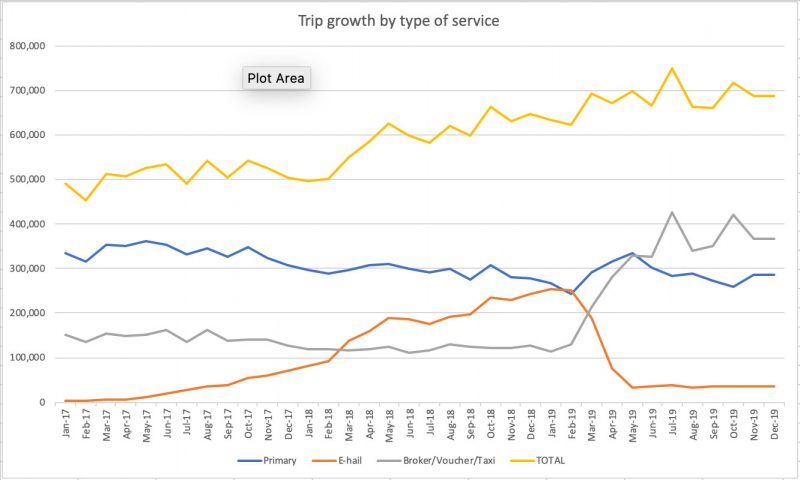
As you can see, the orange line for e-hail flattens out around May of 2019. And, again, based on dashboard data, we can see that the estimates from slide #7 don’t seem to add up. Here are the figures from May-October from the dashboard and an overall average for the 6 month period:
| 19-May | 28 |
| 19-Jun | 30 |
| 19-Jul | 31 |
| 19-Aug | 27 |
| 19-Sep | 30 |
| 19-Oct | 31 |
| 6-month average | 29 |
The overall average and per-user-per-month trip average are all lower than the 32 trip per-user-per-month number presented at April’s board meeting (which was expected to keep rising).
Another thing that is misleading about the presentation is that it doesn’t show the relationship between the number of trips and the different rates for service types. Comparing cost growth to trip growth in the chart above shows that a growth in total trips was outpacing the increase in total costs during the e-hail pilot, and elimination of the e-hail advanced-registration pilot resulted in higher overall monthly costs for most of 2019:
At November’s board meeting, Alex Elegudin made a few extraordinary claims that stood out to me.
“Although many pilot participants are taking a good portion of their trips using on-demand they are still taking many many many trips using traditional paratransit service. And there hasn’t been a total modal shift.”
This claim is impossible to verify without more granular data, but why would someone go through a more laborious process of requesting many, many, many additional advance reservation trips if they have the option to decide when they’re ready to make their trips and request them on demand? And ADA doesn’t allow for any restriction on the number of rides.
“Certain sets of Access-A-Ride customers and the current on-demand pilot have seen more than a tenfold trip utilization increase since the pilot began, and nearly all pilot participants have shown significant trip growth. Based on the current pilot data, the cost of expanding unlimited on-demand service to our entire access-a-ride customer base are projected to run hundreds and hundreds of millions of dollars annually. Moreover, our projections do not account for the very real possibility that more eligible New Yorkers will continue to register for the program. In fact, in 2018 the paratransit budget increased by 150 million dollars at a time of an MTA agency-wide operational budget crisis.“
The first claim about a tenfold trip utilization increase is also impossible to interpret without more data. Does he mean that people started out taking 3 on-demand trips per month and worked their way up to 30? Did they go from 10 to 100? From 20 to 200? This information is useless without more detail about where they started and where they ended up (and how many people he is talking about). “Nearly all pilot participants have shown significant trip growth.” This second claim is clearly not supported by the dashboard data which shows pretty flat usage for the on-demand pilot users over the only 6 month period with clean data for that category. Again, it’s not possible to know who is using on-demand in combination with advanced registration with public data. Finally, the claim that the paratransit budget increased by $150M is clearly at odds with the $62M increase they explained in the April presentation. Perhaps he misspoke and this is what’s projected for 2019?
The December committee meeting presentation about AAR helps to answer that question, but also shows more hidden cost increases for paratransit.
Using the same methods, I took the numbers I could use from the presentation, and the dashboard data (which is current through October, 2019). Here’s the first slide, showing the increase in customers, trips, and overall budget.
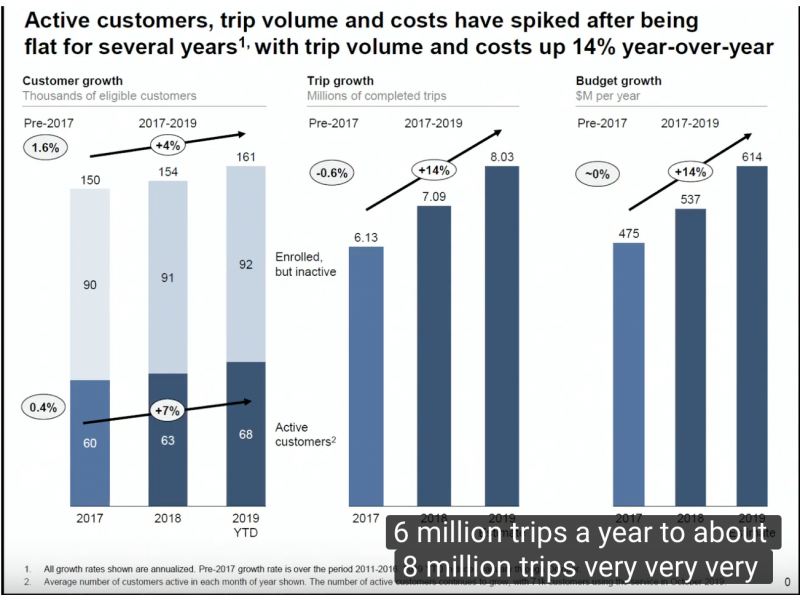
And here is the relevant information in table format (trips and budget) along with the dashboard figures for comparison, and the administrative costs (which are separate from trip costs):
| Trips | Total Cost | Dashboard (trips) | Dashboard (trip costs) | Admin costs (total budget - trip costs) | |
|---|---|---|---|---|---|
| 2017 | 6,130,000 | $475,000,000 | 6,129,219 | $365,089,957 | $109,910,043 |
| 2018 | 7,090,000 | $537,000,000 | 7,092,476 | $425,295,589 | $111,704,411 |
| 2019 | 8,030,000 | $614,000,000 | 8,144,901 | $458,176,051 | $155,823,949 |
| 2018-2019 increase | 940,000 | $77,000,000 | 1,052,425 | $32,880,462 | $44,119,538 |
I used averages based on relevant time frames (10 months for broker and primary, and 6 months for e-hail) to calculate estimate total trips for November and December to come up with an annual total budget assuming that $614M is the total for this entire year. I also increased the broker per-trip cost to $34 since Alex mentioned that the range for those trips was “$30-$34.” Comparing the trip costs alone, we can see a trip cost increase of $33M in one year, while administrative costs shot up by $44M. This is a 56% increase in the total 1-year budget increase of $77M.
That $150M amount from the November meeting? It’s actually $139M over two years. The majority of that 2-year budget increase is accounted for by increases to paratransit carrier service trip increases ($40M in 2018) and administrative cost increases ($44M in 2019) for a total of $84M (or 59% of the 2-year total increase). Net cost increases for e-hail (on-demand and advanced reservation) account for the other $56M, ($17M in 2018 and $39M in 2019 or 41% of the 2-year total increase). Keep in mind that the MTA delivered more than 2M additional trips during that 2-year period (at an average net cost of $27.5 per trip).
Here in table format is a breakdown of those costs:
| Admin Cost Increase | E-hail Cost increase (net) | Carrier cost increase (net) | TOTAL | |
|---|---|---|---|---|
| 2018 | $5,000,000 | $17,057,143 | $40,926,829 | $62,983,972 |
| 2019 | $44,119,538 | $39,526,408 | ($8,010,850) | $75,635,096 |
| TOTAL | $49,119,538 | $56,583,551 | $32,915,979 | $138,619,068 |
I should be writing my dissertation right now, but because of the time-sensitive nature of upcoming pilot changes that will cap rides at 16 trips per month and a $15 subsidy per trip, I have spent a decent amount of time trying to understand and explain why their numbers don’t add up (as other advocates have repeatedly argued). Given that active participants are taking the vast majority of trips, it doesn’t make sense to compare pilot participants to the whole paratransit user base. This chart shows percentages in terms of ridership, trips, and costs for 2018-2019. Since the e-hail on-demand was never separated on the dashboard, I can only use estimates of $8M and 10% of trips (210,000 out of 2.1M for 2018) in the presentation bullet points above. I used estimates based on the six month average to fill out the missing data for 2019 and the $37 average to calculate trip costs:
| On-Demand Ridership | |||
|---|---|---|---|
| as % of total active registrants | as % of total costs | % of total trips | |
| 2018 | 1.90% | 1.89% | 3.00% |
| 2019 | 1.76% | 3.42% | 5.20% |
If 2018 numbers are correct, costs were proportional even though pilot participants took more trips. Ridership ticked up for this group in 2019, but it seems like these 1,200 passengers are getting more mileage for the same price (assuming $37 is the true average cost per trip). This information is crucial to deciding a fair subsidy cap.
My calculations don’t account for a growth in registered passengers in the past 2 years, but they reveal a worrying pattern. The MTA has presented misleading numbers on three occasions now. They used these numbers as justification for ending a popular and promising pilot program that saved them money while allowing them to deliver more trips, and are poised to kill off the on-demand pilot in a similar fashion. Whether the increases to per-trip carrier cost or administrative costs are justified is not as important as the fact that they presented the main driver of cost increases as a result of e-hail service which is demonstrably false.
The plan to cap the number of trips and cost per trip will drastically reduce spending on on-demand service, even while expanding to an additional 1,200 customers. If all 2,400 pilot participants used all 16 trips each month at $15 each, the total for a year is $6.91 million, roughly half of what they spent for on-demand service in 2019, while doubling the number of participants. That means they plan to reduce per-person on-demand costs by 75%. And, that expense will only be realized if the service is utilized fully. Many paratransit customers feel that the restrictions are so severe that no one will be able to use the program at all. Advanced reservation trips, including $86 carrier trips and $34 broker trips will remain unrestricted.
UPDATE: The MTA responded to these inconsistencies. The $44M budget increase in 2019 is explained by the purchase of 700 new vehicles. Without this increase, the budget increase from new riders and increased demand was ~$33M (explained by close to 1M additional trips driven by new users, online booking, and more popular single-occupancy broker and E-hail rides from the year before).
They also explained that inconsistencies from the April 2019 presentation (1 million new $37 trips = $62M) can be understood in terms of efficiency. The cost per traditional trip went up by $11-$12 because of fixed costs. In other words, if they have to pay the same amount of money to deliver fewer rides, each trip will be more expensive.
In order to verify this explanation, I calculated a scenario where the number of traditional paratransit trips didn’t change at all between 2017 and 2018, staying at 4.1M each year. E-hail and broker trips, therefore, didn’t displace the more expensive trips and any new E-hail and broker trips in 2018 represent additional expenses. Under this scenario, the cost per traditional carrier trip still increased by $7. So, inefficiency may explain some part of the increase in per-trip cost, but only about $4.50 per trip. The budget impact would have been nearly $19M less if this $7 per-trip increase didn’t occur.
I have also since learned that the dashboard trips in the E-hail category include “emergency rescue” trips that inflate the total e-hail trips by between 5,000-10,000 per month. Therefore, the monthly average number of trips (among users who took at least one E-hail trip) is closer to 25 per month. The April 2019 slide showing 32 average trips at the tail end for on-demand pilot participants is clearly incorrect, as are other monthly averages that assume that the E-hail data on the dashboard only represents the current 1,200 pilot participants.
WOW! What a wonderful job! This should be presented at the next ACTA meeting to combat all of the smoke, mirrors, and deplorable mathematics. Thank you for your efforts, diligence, and advocacy.