VOICE OUT! Training & Empowering Youth to Become Citizen Data-Journalists

Uncategorized
Graphic Resistance: Telling Data Stories with Images
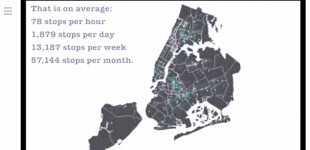
Visualizing big data sets with easy-to-read illustrations can help tell a story and make complex data easier to understand by more people. Learn how to create your own data visualizations and tell your own stories.