I’ve been silent for a while. After spending the balance of the summer recovering from a mysterious virus that had lodged itself in my inner ear, I dove head-first into my data collection and analysis this fall for my dissertation, The New York City Teacher Voice Project. So in the last five months, that’s where I’ve been: collecting, analyzing, aggregating, and wrestling with my data. And I couldn’t be more excited about writing up my findings.
Motivated by my experience as a 5th-grade public school teacher in New York City, my dissertation takes up questions around policy and practice in public schooling and investigates the local knowledge teachers share in their blog posts. As a teacher, my colleagues and I confronted obstacles to our work as teachers on a daily basis — there was a revolving door of schedule changes, too few materials, generally insufficient resources and training, etc. — and found ways to adapt to or resist the circumstances in the name of consistency. And we went through the motions largely on our own. But as online spaces to communicate grew, teachers began blogging about their experiences. It is one assertion of my dissertation that policymakers have something to learn from what is shared in these blogs.
I was thinking the other day about why my work as an educational researcher is so closely tied to my experience. I’ve always been attracted to stories. I majored in anthropology as an undergraduate student, and worked on an oral history project during an internship the summer after I graduated from college. Ethnography, or some digital version of it, was an obvious choice for my work as a doctoral student, and I’m drawn in by the narratives shared by teachers who blog about their daily work in the classroom. The experiences they write about are so similar to mine — from a lack of stall doors in the girls’ bathroom and broken copy machines to insect infestations and faulty internet access — and I’m in the process of weaving together their experiences in a sort of kaleidoscopic word quilt.
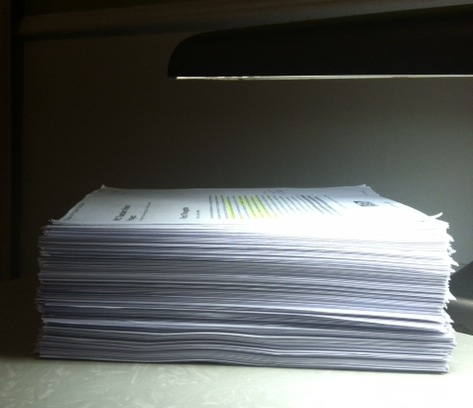 So onward with the writing. Day in and day out till it’s done. In the meantime, I spent time before the holiday break printing out my data. Don’t laugh. Until I did this, I had no sense — and no tangible way of sharing — how “much” data I had. I’ve got quite a bit to work with. And this is the one and only time I’ll every have to do this. Now I have a sense of what a stack of roughly 400 blog posts looks like in the real world.