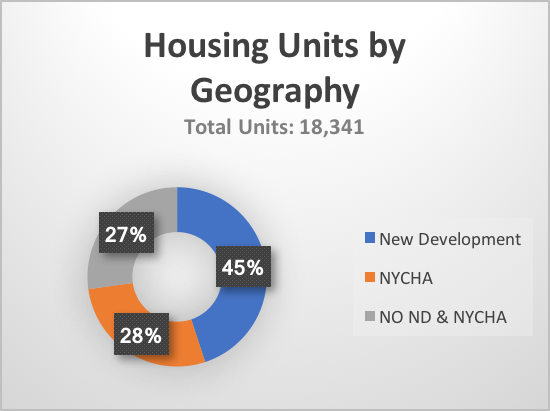
As of 2015, Long Island City has a total of 18,431 housing units, with the majority of those units concentrated in 3 census tracts: 1, 7, and 19 – where the majority of new development has been taking place (i.e. South of the Bridge).
The majority of the occupied housing units in Long Island City are renter occupied (84%), though units are nearly twice as likely to be owner-occupied in New Development (30%) than the neighborhood overall (16%).
Median gross rent for Long Island City is $1,444, just slightly higher than that of the city ($1,255) and Queens County ($1,367). This neighborhood median, however, does not represent the broader geographic distribution of housing cost. For example, comparing the median gross rent for New Development, NYCHA housing, and homes outside either of those – at $2,400, $512 and $1,300 respectively – demonstrates the diversity clearly. Moreover, the median gross rent for units in New Development are nearly twice as high as elsewhere in the neighborhood.
Owner-occupied units vary less. With a median value of $655,477, New Development units are $709,900, while elsewhere in the neighborhood, owner-occupied units value $640,700. Interestingly, the median value for NYCHA units is over a half million ($566,100). Both combined and as separate geographies, the value of owner-occupied units in Long Island City are higher than the media of Queens County ($450,300) and NYC ($493,360).
Table 1. Housing Costs/Values: LIC, QC and NYC, 2000-2015
| Renter-Occupied | Owner-Occupied | |||||
| Median Cost, 2000 | Median Cost, 2015 | % Change 2000-2015 | Median Value, 2000 | Median Value, 2015 | % Change 2000-2015 | |
| New Development | $896.33 | $2,400.33 | 167.79 | $216,066.67 | $709,900.00 | 228.56 |
| NYCHA | $365.50 | $512.00 | 40.08 | $234,200.00 | $566,100.00 | 141.72 |
| NO ND & NYCHA | $706.80 | $1,299.71 | 83.89 | $203,700.00 | $640,700.00 | 214.53 |
| ALL LIC | $699.20 | $1,443.58 | 106.46 | $210,240.00 | $655,477.78 | 211.78 |
| Queens County | $775 | $1,367 | 76.39 | $206,200 | $450,300 | 118.38 |
| NYC | $705 | $1,255 | 78.01 | $217,769 | $493,360 | 126.55 |
New Development
Between 2000 and 2015, Long Island City experienced a 56% increase in housing units. Significantly, with a 187% increase, this residential development was concentrated in New Development. Conversely, NYCHA developments and the other census tracts in the neighborhood outside of New Development experienced much slower growth (24% and 18% respectively). On the whole, Long Island City experienced greater development than Queens County (3% increase) and NYC (7% increase).
Table 2. Housing Units for LIC: QC and NYC, 2000-2015
| # Housing Units, 2000 | # Housing Units, 2015 | % Change 2000-2015 | |
| New Development | 2875 | 8,241 | 186.64 |
| NYCHA | 4435 | 5,113 | 15.29 |
| NO ND & NYCHA | 4476 | 4,987 | 11.42 |
| ALL LIC | 11786 | 18,341 | 55.62 |
| Queens County | 817,250 | 844,189 | 3.30 |
| NYC | 3,200,912 | 3,422,225 | 6.91 |
Relatedly, in a recent study RENTCafé found that since 2010, Long Island City has seen the most new apartments built among neighborhoods across the country[1]. Their takeaway?:
“More than a decade ago, Long Island City was tagged to become a hot nabe. It had the 3 things that any neighborhood deemed for greatness needs: location, location, and location. In a matter of just a few years, the neighborhood has gone from dated industrial vibe to gleaming new glass towers, to take the number 1 spot for building by far more apartments than any other neighborhood in the country has done in recent (post-recession) history. A massive total of 12,533 new apartments in 41 buildings were built between 2010 and 2016 in this Queens neighborhood.”
Between 2000 and 2015 housing costs/values have also risen, and at rates much faster than the county and city more broadly (See Table 1). From 2000 to 2015, median gross rent in Long Island City saw a 106% increase from $699/month to $1444/month, while the median value of owner-occupied homes increased 212% up from $210,240 to $655,477. In New Development the increases were more stark. Median gross rent increased 168% – from $896/month to $2,400/month – while the value of owner-occupied units rose 229% – from $216,066 to $ $709,900. All of these figures are well above the cost/values increases across Queens County and the City as a whole, if not doubling them.
If we look closer at the cost-breakdown of the rental housing stock today (2015), these figures become more comprehensible. Eighty-nine percent of units in New development cost $1,250 per month or more, with 66.3% of rental units cost $2,000 or more per month. This is striking in comparison to Queens County ($1,250+:60% ; $2,000+:10%) and NYC ($1,250+:50% ; $2,000+:16.2%). Figures for residents not living in New Development or in NYCHA are more consistent though slightly higher to the figures of Queens County and NYC ($1,250+:55% ; $2,000+:12%). Similarly, while Long Island City on the whole, has a slightly larger proportion of rental units under $1000, New Development has 3 times less rental units in this under $1000/mo price range than Queens Country, and more than 4 times less units than NYC.
Table 3. Price Ranges for Renter-Occupied Units: LIC, QC and NYC, 2015
| # Renter-Occupied Units | % Rent under $1000/mo | % Rent over $1250/mo | % Rent over $2000/mo | ||||
| New Development | 5263 | 6.97% | 88.50% | 66.30% | |||
| NYCHA | 4703 | 80.60% | 15.05% | 3.80% | |||
| NO ND & NYCHA | 3825 | 29.39% | 55.40% | 11.90% | |||
| ALL LIC | 13791 | 32.32% | 56.95% | 24.15% | |||
| Queens County | 425,183 | 21.0% | 60% | 10.1% | |||
| NYC | 2,065,708 | 31.7% | 50% | 16.2% | |||
Owner-occupied units follow a similar trend where New Development units are valued substantially higher than other areas in Long Island City, as well as overshadow county- and city-wide trends.
Table 4. Value Ranges for Owner-Occupied Units: LIC, QC and NYC, 2015
| # Owner-occupied Units | Value Under $300,000 | Value over $750,000 | Value over $1,000,000 | |
| New Development | 769 | 7.03% | 45.20% | 15.90% |
| NYCHA | 176 | 59.15% | 2.60% | 0.00% |
| NO ND & NYCHA | 632 | 17.79% | 33.16% | 4.81% |
| ALL LIC | 1577 | 21.99% | 31.08% | 6.78% |
| Queens County | 340,561 | 24.6% | 13% | 3.2% |
| NYC | 991,350 | 19.7% | 23% | 12.5% |
Cost-Burden
Amidst these changes in the housing stock of LIC, we are also seeing changes in the proportions of households struggling to meet their housing costs, though on the who, these changes don’t differ substantially from county- and city-wide figures. A household is consider cost-burdened when they allocate more than 30% of their income to covering housing costs, and severely cost-burdened when they allocate more than 50% of their income to covering housing costs. Despite increases in housing costs, cost-burden in New Development is very low. However, NYCHA residents and residents not living in New Development have experienced increases in the proportion of households considered to be cost-burdened on part with county- and city-wide trends. Importantly, there was a 12.3% increase in the number of severely cost-burdened renters not living in NYCHA or New Development, which is a greater change than at the county- and city-wide level.
These figures should be understood in relation to not only changes in housing cost, but also the incomes of residents.
Table 5. Cost-Burden among Renters: LIC, QC and NYC, 2000-2015
| 2000 | 2015 | % Change 2000-2015 | ||||
| Cost-Burdened | Severely Cost-Burdened | Cost-Burdened | Severely Cost-Burdened | Cost Burden | Severely Cost-Burdened | |
| New Development | 14.40% | 18.53% | 17.37% | 20.10% | 2.97% | 1.57% |
| NYCHA | 17.10% | 17.30% | 30.40% | 18.65% | 13.30% | 1.35% |
| NO ND & NYCHA | 20.18% | 17.00% | 22.70% | 29.26% | 2.52% | 12.26% |
| ALL LIC | 19.77% | 17.04% | 22.65% | 25.20% | 2.88% | 8.16% |
| Queens County | 19.1% | 20.7% | 23.5% | 23.1% | 4.40% | 9.00% |
| NYC | 18.4% | 22.3% | 29.7% | 28.3% | 4.70% | 6.00% |
NOTES:
[1] “[RENTCafé] analyzed construction data from Yardi Matrix and Property Shark, in about 1,000 neighborhoods from coast to coast, to see which neighborhoods grew the most from a rental perspective. We took into account large-scale rental buildings of 50 or more units located in the largest 30 cities in the U.S.” (Balint, Nadia. Top U.S. Neighborhoods that Got the Most Apartments After the Recession. May 26, 2017. RENTCafé Blog)